Reproducing the issue:
- 重啟IIS (IISReset)
- 瀏覽http://localhost/BuggyBits/AllProducts.aspx
- 當瀏覽這個網頁時,觀看工作管理員的CPU使用率
- Q: What is the CPU usage like for w3wp.exe during the processing of this request?
- A: Very high, approaching 100%
Set up a performance counter log:
- 參考.NET Debugging Demos Lab 3: Memory - Review 並設置performance counter log
Prepare to gather a memory dump:
Reproduce the issue again and gather the memory dump:
- 開啟五個Thread同時連結http://localhost/BuggyBits/AllProducts.aspx
- 移至tinyget 目錄並執行
- tinyget -srv:localhost -uri:/BuggyBits/AllProducts.aspx -threads:5 -loop:1
- 使用winform或壓測軟體實現
- 當CPU使用率飆高的時候,再取Dump,不放心的話可以多dump幾次
- 停止Performance Monitor 的log
Open the dump to figure out what it is doing:
- 開啟Dump
- Load up the symbols and sos
- 寫這篇的時候我的系統變成win 8, IIS8所以單純複製SOS到debugger資料夾下已經不能運作
- .loadby sos clr
Verify that you took the dump at the right time:
- 執行 !threadpool 看看系統的CPU 使用率,已確認是否dump在對的時間
- Q:What is the CPU usage?
- A:The CPU usage for the system is 77% according to !threadpool.
0:000> !threadpool
CPU utilization: 77%
Worker Thread: Total: 4 Running: 2 Idle: 2 MaxLimit: 32767 MinLimit: 4
Work Request in Queue: 0
--------------------------------------
Number of Timers: 2
--------------------------------------
Completion Port Thread:Total: 1 Free: 1 MaxFree: 8 CurrentLimit: 1 MaxLimit: 1000 MinLimit: 4
- Q:這裡所顯現的CPU使用率如何表示CPU使用率與Process之間的關係?
- A:這是一個陷阱題,他並不能。這裡顯示的是系統的CPU使用率,所以一定是這個Process用了大量的CPU或者某個Process用了大量的CPU。通常這樣的指令可以用在一個專門的Web Server上時,可以提供大概的資訊,但是使用performance logs 進行確認是比較好的方式。
- 擱置
- Q: If you ran tinyget you may see some requests queued up eg: Work Request in Queue: 4, why are requests queueing up? Why aren't they scheduled on threads? (Compare Running worker threads and Maxlimit for worker threads)
- A: In this case I actually ran tinyget twice. I have 5 worker threads, all running requests and although that is far from the max setting (100 threads/proc, and 2 procs = 200), no new threads will be started when CPU usage is over 80% so any requests that came in after it started going towards 100% will be sitting in the queue waiting for new threads to be started or freed.
Determine which threads have been consuming most of the CPU time
- 執行 .time 檢視Process的正常運作時間及CPU 使用時間
0:000> .time Debug session time: Tue Mar 12 14:56:14.000 2013 (UTC + 8:00) System Uptime: 0 days 20:25:43.350 Process Uptime: 0 days 0:00:26.000 Kernel time: 0 days 0:00:12.000 User time: 0 days 0:00:27.000- 執行 !runaway 檢視所有Thread的使用時間
0:000> !runaway User Mode Time Thread Time 24:704 0 days 0:00:05.156 23:1d60 0 days 0:00:04.796 25:b8c 0 days 0:00:04.296 22:1a2c 0 days 0:00:04.156 20:10a8 0 days 0:00:02.468 26:1f10 0 days 0:00:02.203 21:1278 0 days 0:00:02.125 27:1fd4 0 days 0:00:01.984 15:11d8 0 days 0:00:00.250 14:1210 0 days 0:00:00.187 13:1910 0 days 0:00:00.187...- Q:從 !runaway 中哪些Threads花了最多的CPU?
- A: Thread 20~27他們所花費的時間總合為27.184
- Q: 在.time的輸出中,usermode 花了多少CPU時間?
- A: 從.time的輸出中,可以看見Process使用時間為26秒,usermode 花了27秒
- Note: Looking at !runaway output can be a bit tricky for multiple reasons.
- First off, on a multiproc machine you have to remember that the usermode time (i.e. clock cycles spent in usermode code) is CPU time spent on all processors, therefore the usermode time may add up to more than elapsed time (process uptime).
- Secondly, the !runaway output shows the total usermode time spent on that thread since it was started. In asp.net for example a thread may be reused for multiple requests so a high usermode time on a thread does not neccesarily mean that the requests running on that thread is a big CPU consumer.
- And finally, some threads like the GC threads (in multiproc, serverGC processes) stay alive for the duration of the process, so they have a higher chance of accumulating a lot of usermode time than worker threads, therefore it is really more interesting to look at two consecutive dumps and compare the differences in usermode time.
- 記下使用較多User time的Thread並檢視他們的stack
- ~#s (set thread context, note # should be replaced with the appropriate thread number from !runaway)
- kb 2000 (look at the native stack)
- !clrstack (look at the .net stack)

- Q: Thread做了些什麼?根據stack的輸出,可以推論出是甚麼導致高的CPU使用率嗎?
- A:
- Thread20~21
- 000000cd`5e97f438 000007fe`7fc610ea ntdll!NtWaitForSingleObject+0xa
- 000000cd`5e97f440 000007fe`703fe522 KERNELBASE!WaitForSingleObjectEx+0x92
- 000000cd`5e97f4e0 000007fe`703fe6cd clr!CLRSemaphore::Wait+0x8a
- 000000cd`5e97f5a0 000007fe`703fe678 clr!ThreadpoolMgr::UnfairSemaphore::Wait+0x16a
- 000000cd`5e97f5e0 000007fe`70400a16 clr!ThreadpoolMgr::WorkerThreadStart+0x1ff
- 000000cd`5e97f6a0 000007fe`8257167e clr!Thread::intermediateThreadProc+0x7d
- 000000cd`5e97f8e0 000007fe`82c1c3f1 kernel32!BaseThreadInitThunk+0x1a
- 000000cd`5e97f910 00000000`00000000 ntdll!RtlUserThreadStart+0x1d
- Thread 22~25
- Child-SP RetAddr Call Site
- 000000cd`5ed2f418 000007fe`7fc610ea ntdll!NtWaitForSingleObject+0xa
- 000000cd`5ed2f420 000007fe`702145af KERNELBASE!WaitForSingleObjectEx+0x92
- 000000cd`5ed2f4c0 000007fe`70214567 clr!CLREventBase::WaitEx+0x16c
- 000000cd`5ed2f500 000007fe`702144e8 clr!CLREventBase::WaitEx+0x103
- 000000cd`5ed2f560 000007fe`70362043 clr!CLREventBase::WaitEx+0x70
- 000000cd`5ed2f5f0 000007fe`70400a16 clr!SVR::gc_heap::bgc_thread_function+0x83
- 000000cd`5ed2f630 000007fe`8257167e clr!Thread::intermediateThreadProc+0x7d
- 000000cd`5ed2f970 000007fe`82c1c3f1 kernel32!BaseThreadInitThunk+0x1a
- 000000cd`5ed2f9a0 00000000`00000000 ntdll!RtlUserThreadStart+0x1d
- Thread 26處於gc_heap::wait_for_gc_done
- Thread 27處於GCHeap::WaitUntilGCComplete,根據原文的說法,27正在等著GC完成,所以屬於iddle。
- 這只適用於multi-proc machines因為他們有各自的GC threads。加總在!runaway中GC threads所佔的時間,並且除以總合的usermode time
- Q:GC threads總共花了usermode time的多少時間?
- A: Thread 22~25總共用了18.404秒 => 約68%的CPU time

Examine the performance counter log:
- 開啟performance counter log並且加入.NET CLR Memory
- % Time in GC,
- # Gen 0 Collections,
- #Gen 1 Collections,
- #Gen 2 Collections and Large Object Heap Size

- Q: 計數器% Time in GC計算的是甚麼?
- A: "% Time in GC"是花費在自上次GC週期後執行garbage collection(GC)所花費時間的百分比。這個計數器通常是一種工作的指標,藉由
- This counter is usually an indicator of the work done by the Garbage Collector on behalf of the application to collect and compact memory. This counter is updated only at the end of every GC and the counter value reflects the last observed value; its not an average." in other words this is bound to spike up a bit after a Gen 2 collection but the important part here is that the average time in GC doesn't end up too high.
- Q: What is the average % Time in GC during the stress run?
- A:73%左右。這完全取決於你是使用single proc or multiproc box因為 server GC and workstation GC的最佳化完全不兩件不同的事情。運行ASP.NET 下的server GC屬於multiproc boxes 將會執行更多full collections, relocation and compact memory more。而workstation version在必須耗費高記憶體使用率的情況下則會省去部分的full collections, relocation and compact memory 。
- Q: 怎樣的"% Time in GC:數值是洽當的?
- A: 這也是個陷阱題,有時候是5有時候是30。在大部分的ASP.NET應用程式下要只有5%是非常困難的,特別是那些擁有高記憶體使用率的。然而根據經驗如果Process進行garbage collection必須耗費超過30%的CPU使用率,這就有點詭異的。抱持著一定會是比較低"% time in GC"的想法也是有陷阱的,因為這通常涉及到要改變應用程式的allocation patterns。這就有點像是在最佳化,試著達到最適合的水平但除非必要不然也不能過頭。
- Q: What is the ratio between Gen 0, Gen 1, and Gen 2 collections? What should it be in an optimal scenario and why?
- A: Gen 0 collections are basically free. Gen 1 collections (which includes Gen 0 collections) are also pretty cheap since we are still dealing with a low amount of memory that needs to be collected, relocated etc... Gen 2 collections on the other hand can get really really expensive since it deals with the whole .net GC heap. An optimal ratio would be to see 100 Gen 0 collections, per 10 Gen 1 collections and 1 Gen 2 collection, so 100:10:1. In my case the numbers are
- 5853 Gen 0 Collections
- 5830 Gen 1 Collections
- 5430 Gen 2 Collections
- That means that pretty much every single collection that was done was a Gen 2 collection (since this also triggers a 1 and 0 collection) which is really bad since it means that we take no advantage of having a generational GC, we basically scavenge through all memory all the time.
- Q: What can cause a ratio like this?
- A: Generally two things cause this type of ratio. Either the allocation pattern is such that pretty much all your allocations are for large objects so the large object heap segments get exhausted all the time or you constantly call GC.Collect directly or through something like GC.GetTotalMemory(true). If someone does induce a GC (i.e. call GC.Collect) you will see the .NET CLR Memory/# Induced GC counter go up but in this particular case it stays flat which means that the reason is likely that we constantly allocate large objects.

Look at the memory dump to figure out what caused the high CPU in GC:
- Run ~* kb 2000 to get all native stacks and search for the thread that triggered the GC (mscorwks!SVR::GCHeap::GarbageCollectGeneration)


- Q: 為什麼GC會被觸發?
- A: 因為程式正嘗試著allocate a large object (clr!SVR::gc_heap::allocate_large_object+0x92) 所以我們需要更多的空間於是觸發了 garbage collection. The object we are trying to allocate is 0x47470 = 291952 bytes which is why it ends up on the large object heap.(還不會從code裡去看哪個是size)
- Q:allocating的是哪一種形式的object?
- A: 必須從有allocate記憶體的是Thread 26 經由 !clrstack後發現他並未包含更進步部的object type反而是Thread 27經由kb 2000的內容中可以發現,它具有wait for gc complete但是在!clrstack中卻有明確指示如原作者所提的object type的呈現。
- Q: 該Thread在幹嘛(原文指的是內涵 waitfor gc done的Thread但我必須對應到waitfor gc complete)?
- A: 該程序接受了AllProducts.aspx的要求並呼叫Page_Load,該function為執行串接String也就是 str1 = str2 + str3.
- Q: Could this be causing the bad Gen 0, Gen 1, Gen 2 ratio? Why?
- A:將大量的字串串在一起會導致GC的高CPU使用率。相關的原因原作者在this article 已經解釋得很詳細,所以這邊就不深論。但是基本上當執行str = str + str2 迴圈時,將會生成新的字串而不是擴展字串。如果迴圈必須要執行一陣子而且是很大的字串,那Process將會不斷的創造比原本大一些的字串,這會使LOH segments 經常得疲於奔命,必且導致 a lot of full GCs and high CPU in GC.
- 找出佔住large object heap的是甚麼(note:如果不幸地你有可能會擷取到正在規劃或是正處於relocate 得GC,在這個情況之下!dumpheap的結果可能會有誤。如果是這樣試著在你所得到的stack中執ㄒㄧ!dumpheap -min 85000)
0:000> !dumpheap -min 85000Address MT Size 000000cd22c01018 000007fe6f31c358 1581560 000000cd22d83210 000007fe6f31c358 1524280 000000cd22ef7448 000007fe6f31c358 1581720 000000cd230796e0 000007fe6f31c358 1524440 000000cd231ed9b8 000000c91230e820 1688758 Free 000000cd23389e70 000007fe6f31c358 1580920 000000cd2350bde8 000007fe6f31c358 1581080 000000cd2368de00 000000c91230e820 4726438 Free 000000cd23b0fca8 000007fe6f31c358 1581240 000000cd23c91d60 000007fe6f31c358 1581400 000000cd42c81098 000000c91230e820 7617398 Free 000000cd433c4c10 000007fe6f31c358 1523960 000000cd43538d08 000007fe6f31c358 1524120 Statistics: MT Count TotalSize Class Name 000000c91230e820 3 14032594 Free 000007fe6f31c358 10 15584720 System.String Total 13 objects- Q: What is on the large object heap?
- A: 原作的回答是,在他的case中,剛好是擷取到GC的中段,也就是說沒有辦法完整的追蹤到全部的heap,也就是說!dumpheap -min 85000並不會呈現完整的large objects ,不過還是可以藉由這次的結果發現大概的組成為Byte[] and Strings,這兩個就是執行string串接的重要物件,也就是問題的原因。但是在我的case中,我只看得出佔最大部份的是String。
- Q: Is there any pattern in the sizes of the strings?
- A:在這個特殊的例子中並不全部但是有一些是成對的string(1524120&1523960、1581240&1851440、152280$1524440、1581560&1581720 ) ,所有成對的string其大小剛好都差160byte。如果你剛好dump在heap沒有動作的時候,就有可能會看到一長串的清單,而且都是隨著160byte的大小增長,基本上這是因為每個在Page_Load method執行時所重複串接的字串,大概都是160byte。
- Dump out a few of the strings to see the contents
- !do <address of string>
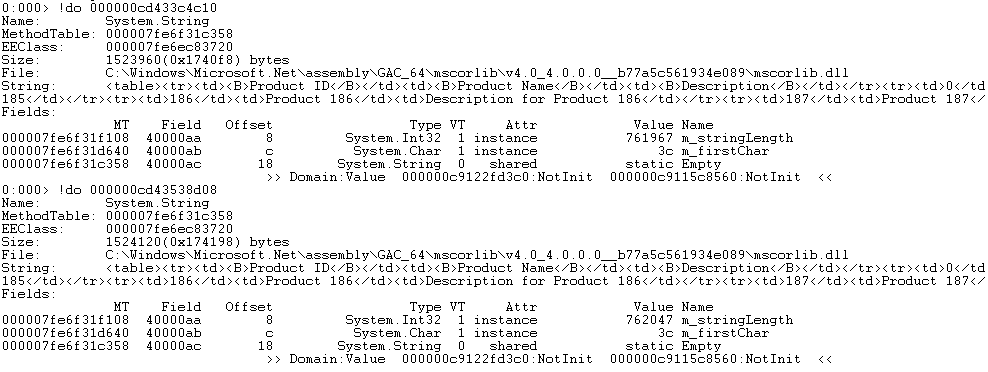
- Q: Based on the stacks, the knowledge of the collection ratios and the string contents, can you determine what went wrong. You might want to do some internet searches on some of the calls on the stacks if you don't know the answer immediately.
- A: As mentioned before, it appears to be the string concatenation in Page_Load that is causing the high CPU. The method appears to be assembling a table of products.
Verify your assumption in the code and modify the code to resolve the issue
- Open AllProducts.aspx.cs and look at the code for Page_Load
protected void Page_Load(object sender, EventArgs e) { DataTable dt = ((DataLayer)Application["DataLayer"]).GetAllProducts(); string ProductsTable = "<table><tr><td><B>Product ID</B></td><td><B>Product Name</B></td><td><B>Description</B></td></tr>"; foreach (DataRow dr in dt.Rows) { ProductsTable += "<tr><td>" + dr[0] + "</td><td>" + dr[1] + "</td><td>" + dr[2] + "</td></tr>" ; } ProductsTable += "</table>"; tblProducts.Text = ProductsTable; }- Q: What line of code is causing the problem?
- A: The bolded line looks like the culprit here.
- Q: How do you resolve it? Why does this resolve the problem?
- A: Use a StringBuilder and append data rather than concatenating strings. The reason this resolves the issue is because the string builder has a buffer that it fills up when you append so it fills up the existing buffer and doesn't have to create a new one all the time. When it needs to expand the buffer it doubles it so the amount of times the app has to make new allocations on the LOH is decreased by a factor of 100 or 1000 in this case. If you change it to use a string builder instead you will see what I mean... the CPU usage will drop, the execution time is vastly different and if you look at the number of GCs that occurr you will notice that instead of making around 5000 or so garbage collections we are talking about less than 10 full GCs.
沒有留言:
張貼留言